Skip Navigation
As almost anyone who runs a website knows, Google Analytics provides insight into who site visitors are and what they do when they come to a website. Marketers use Google Analytics to understand the effects of marketing campaigns and how a site's user experience impacts factors such as conversion and retention.
The hundreds of metrics and dimensions available in Google Analytics may seem daunting. We've zeroed in on 14 essential metrics for marketers, how to find them in the Google Analytics dashboard and via the API, and how marketers can use them to make data-driven business decisions.
Google Analytics for marketers
The Google Analytics dashboard is organized in four sections:
- Audience helps you explore who your customers are, including information such as demographics, location, retention, and device technology. With these metrics, you can interpret the impact of your marketing efforts on various user segments.
- Acquisition shows you how customer get to your website. In the Channels section under All Traffic, you can dig into what channels (organic traffic, social media, email, ads, etc.) deliver the most traffic. You can compare incoming visitors from Facebook versus Instagram, determine the efficacy of your SEO efforts on organic search traffic, and see how well your email campaigns are running.
- Behavior explains what customers do on your website. What pages do they visit? How long do they stay? You can examine these metrics to understand the overall user experience and its effects on retention and engagement.
- Conversions tracks whether customers take actions that you want them to take. This typically involves defining funnels for important actions — such as purchases — to see how well the site encourages these actions over time.
Google Analytics separates data into dimensions and metrics. Dimensions are categorical attributes, such as the city where a user is located or the browser they use, while metrics are the quantitative measurements, such as number of sessions or pages per session. According to Google, "Not every metric can be combined with every dimension. Each dimension and metric has a scope: user-level, session-level, or hit-level. In most cases, it only makes sense to combine dimensions and metrics that share the same scope." For a list of valid dimension-metric pairs, use the Dimensions and Metrics Reference.
Typically dashboards allow segmentation by one or more dimensions as a means to filter down sets of metrics. These data points can also be accessed using the Google Analytics Core Reporting API with the syntax ga:identifier. Through the API you can query the metrics and dimensions or use a third-party ETL tool such as Stitch for integration into a data warehouse for more comprehensive analytics.
ETL data from Google Analytics to your data warehouse
14 metrics that marketers should export from Google Analytics
When analyzing Google Analytics data, there are 14 metrics that all marketers should include and understand:
Audience
1. Number of users and sessions
The users metric provides the number of unique individuals visiting a website over a given time period, and sessions are the number of times that users are actively engaged with the site. For instance, if you have 100 users and 200 sessions, it's reasonable to infer that each user visited the site two times on average during the specified time period.
You can access user and session data in the Audience > Overview. You can then select Sessions or Users in the dropdown directly above the primary graph:
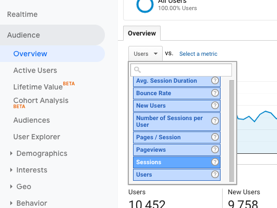
If you're accessing the metrics through the API, use ga:users and ga:sessions.
These metrics provide a quick and coarse-grain analysis of marketing efforts. When you plot the data over time, you can determine how your campaigns drive traffic and how many times users engage with the site.
2. Average session duration
Average session duration is the average amount of time that a user spends on the website in a single session. You can find this in Audience > Overview, then click on the dropdown above the first graph, or if you're accessing the metric through the API, use ga:avgSessionDuration. This metric is a good high-level proxy for user engagement.
3. Average pages per session
Average pages per session is the number of pages a user views, on average, in a single session on your site. You can find this in the dropdown in the Overview section under Audience, or if you're accessing the metric through the API, use ga:pageviewsPerSession. The number of pages with which a user interacts is another good proxy for user engagement. It's wise to look at both this metric and average session duration, however, as the structure of user funnels or the amount of content (e.g. long text blocks) can affect the ratio of session duration versus page views.
4. Ratio of new to returning visitors
In Audience > Overview, you can also compare two metrics by clicking the link that says "Select a metric" to the right of the primary dropdown:
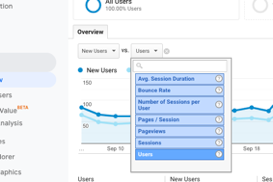
If you're accessing the metric through the API, use ga:users and ga:newUsers.
By comparing the ratio of new users to returning users, you can determine how well your campaigns drive new or existing user traffic. Both are important metrics, as returning users can indicate an increase in lifetime value (LTV), while an increase in new users can indicate growth.
5. Bounce Rate
Bounce rate is the percentage of users who visit only one page on a website before leaving. You can find this metric in the dropdown in the Overview section under Audience, or if you're accessing the metric through the API, use ga:bounceRate. A high bounce rate may indicate a technical problem, content that fails to sufficiently address a user need, a page with no internal links or calls to action (CTA), or poor user targeting in marketing campaigns.
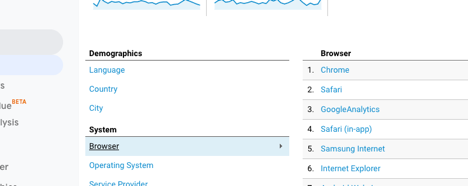
If your bounce rate is high, you should segment your site visitors to see if you can determine the underlying issue. For example, at the bottom of the Overview page, you can select Browser to determine if the site performs better or worse for visitors using different browsers:
Acquisition
6. Organic vs. paid sessions
Organic search traffic is traffic from users who came from a non-paid search engine results page (SERP). Paid Search is traffic from users who clicked on an advertisement on a SERP. You can find this data in the All Traffic section under Channels:
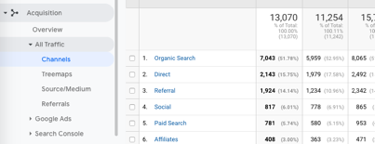
If you're accessing the metrics through the API, use ga:acquisitionTrafficChannel.
The Organic Search metric indicates the effectiveness of your SEO strategies, while Paid Search indicates the effectiveness of your ad campaigns. Both metrics are important, but organic traffic is essential to the long-term sustainability of your site.
In addition to comparing organic versus paid searches for the purpose of analyzing marketing campaigns, you should use the organic search engine result page traffic to determine how well your content performs relative to other organic content on a SERP, particularly on Google.
7. Google Ads
You can access detailed metrics about your Google Ads campaigns by linking your Google Ads account to your Google Analytics account. Doing this can help you analyze customer activity on your website after an ad click or impression. The Search Queries section is useful when you need granular data — such as click-through and conversion rates — for every search query that resulted in a site session:
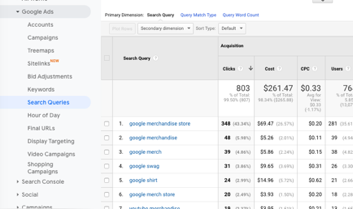
If you're accessing the metrics through the API, use ga:adMatchedQuery.
8. Search Console – Queries
The Search Console section provides detailed analytics on organic searches. Here, you can analyze the queries that have good positions but poor click-through rates, or landing pages that have relatively high click-through rates but poor positioning.
Behavior
9. Newsletter opens
By setting up email tracking into your Google Analytics account, you can analyze the success of email campaigns, and break down the traffic by other characteristics, such as browser and demographics. You can find this data in the Behavior section, under Events and Overview. Then scroll to the bottom where the events are located and select the name of your newsletter click event. At the bottom of this page, you can then select "Secondary dimension" to break the results down by other metrics:
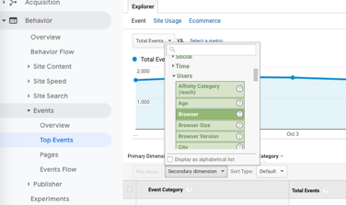
By breaking down newsletter open events by device, for instance, you can determine whether the email campaign is getting better or worse click-through on mobile devices versus desktop and tablets.
10. Average time on page
You can examine the amount of time that users spend on a page to better understand how good the user experience is and how well your marketing campaigns are targeting relevant customers. To view your historical average time on page, go to the Behavior section, click Overview, and select "Avg. Time on Page" from the dropdown above the primary graph:
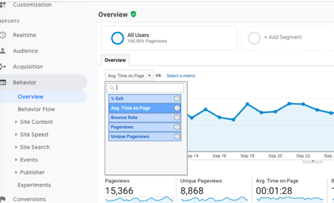
If you're accessing the metric through the API, use ga:avgTimeOnPage.
Average time on page is an indicator of engagement. A high average time on page and/or low bounce rate indicates customers are interested in your content and in exploring your website. You can look at this metric for individual pages for additional context on what content performs better or worse.
11. Top queries in search
Google Analytics allows you to inspect site search data from your website to track queries and customer information by looking at the terms entered in the search bar. You can find this metric in the Behavior section by clicking on Site Search. After you begin sending site search data, you can track your users' search queries; this is an indicator of what content they expect to find on your website, as well as which terms lead to high engagement as defined by metrics such as time after search or exit rates.
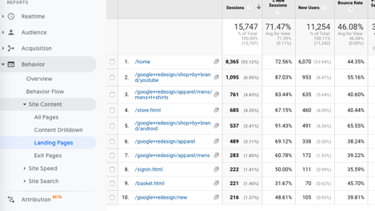
12. Top 10 landing pages
The Landing Pages metric can help you to determine which pages receive the most traffic, which can help you evaluate user experience, content quality, and marketing campaign efficacy. You can find it in the Behavior section under Landing Pages.
13. AdSense revenue
You can track advertising metrics by linking your AdSense account with Google Analytics. After the accounts are connected, the data will start showing up in the Behavior section under Publisher. This section provides metrics such as impressions, clicks, and revenue, which may indicate how well you monetize your pages and help you determine how to optimize them. If you're accessing this through the API, use metrics such as ga:adsenseRevenue and ga:adsenseAdsViewed.
Conversions
14. Goal conversion rate
Goals are specific interactions with the website that define a target objective. Typical goals could include a purchase or a user registration, but a goal also may be defined as a user who visits a certain number of pages, or when a user downloads a piece of content. By tracking conversion rates over time, you can determine how well marketing efforts lead to goal conversions, and use other user metrics to understand what factors affect their successes or failures. You'll find goal conversion rate in Conversions > Goals > Overview; then click on the dropdown above the graphs:
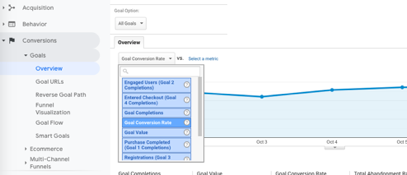
If you're accessing the metric through the API, use ga:goalXXCompletions, where XX is the name of your goal.
Integrate data from more than 100 sources
The limitations of Google Analytics
Google Analytics provides valuable information on users and their behaviors, but it has limitations, particularly for large organizations that have strict access control and permissioning systems. Google Analytics does not provide much control over multiuser access, and it may be inappropriate to share the dashboards with a large number of analysts. Furthermore, not all dimensions and metrics can be queried together.
To get a fuller view of your organization's website performance, you may wish to integrate Google Analytics data with metrics from other platforms. Many organizations use additional third-party analytics apps such as Heap, Snowplow, and Mixpanel, and you can make valuable discoveries by integrating this data for analysis.
In order to integrate data from disparate sources, most businesses need a cloud data warehouse where they can use an ETL solution to extract data from Google Analytics and other apps, and replicate, process and analyze the data.
Integrate and analyze your marketing data
Analyzing marketing and website data begins with determining which metrics are important to your business, then using an ETL tool to bring them into a single repository on which you can run your analysis.
Stitch makes it easy to replicate data from more than 100 sources, including Google Analytics, into a cloud data warehouse, from which you can perform the in-depth analysis that you need. Sign up for a free trial of Stitch and start analyzing your website data in minutes.
Give Stitch a try, on us
Stitch streams all of your data directly to your analytics warehouse.
Set up in minutesUnlimited data volume during trial